Search results
Search for "frequency noise" in Full Text gives 19 result(s) in Beilstein Journal of Nanotechnology.
Numerical study on all-optical modulation characteristics of quantum cascade lasers
Beilstein J. Nanotechnol. 2022, 13, 1011–1019, doi:10.3762/bjnano.13.88

- terahertz band, it can cover most of the gas molecular-fingerprint absorption spectrum and atmospheric transmission window, and it will not damage organisms. Modulation of QCLs is an effective method of suppressing low-frequency noise and improving the signal-to-noise ratio. Various approaches to modulation


Direct measurement of surface photovoltage by AC bias Kelvin probe force microscopy
Beilstein J. Nanotechnol. 2022, 13, 712–720, doi:10.3762/bjnano.13.63

- changes in surface potential induced by modulated external disturbances such as electric fields, magnetic fields [70][71], and stress fields [72][73]. Appendix Sensitivity of AC-KPFM in the FM mode The sensitivity of AC-KPFM in the FM mode is comparable to the sensitivity of FM-KPFM. The frequency noise
- density nFM is described as [74] where ntherm is the thermal noise density, ndetect is the detector noise density, nosc is the oscillator noise density, and nds is the deflection sensor noise density. The frequency noise δf measured with a bandwidth of B at a center of fm is described as When fm ≫ B, δf
- is described as Here, we note that the frequency noise derived from ndetect is proportional to fm and small fm yields a low noise level: For a small oscillation amplitude, the measured signal strength in AC-KPFM is approximately expressed as Therefore, the minimum detectable voltage δV is described


Approaching microwave photon sensitivity with Al Josephson junctions
Beilstein J. Nanotechnol. 2022, 13, 582–589, doi:10.3762/bjnano.13.50

- -tight box with a superconducting shielding on the coldest plate. The dc bias wires were filtered with feedthrough capacitors at room temperature and RC filters at the 10 mK cryostat plate, minimizing the effect of unwanted low-frequency noise. For an experiment with microwave radiation, we used phosphor
- sensitivity if residual low-frequency noise or overheating of the junction could be decreased. The source of the issue and the way of its suppression need to be investigated in further experiments. Comparing the obtained results for the considered sample with other small-area junctions [7][23], we can


A broadband detector based on series YBCO grain boundary Josephson junctions
Beilstein J. Nanotechnol. 2022, 13, 325–333, doi:10.3762/bjnano.13.27

- of magnitude [34][35]. It does not take into account the increase in output noise due to the influence of low-frequency noise spectra of the critical current fluctuations δIc and normal resistance fluctuations δRN associated with the transport mechanisms of the Cooper pairs and quasiparticles


Numerical analysis of vibration modes of a qPlus sensor with a long tip
Beilstein J. Nanotechnol. 2021, 12, 82–92, doi:10.3762/bjnano.12.7

- the measurement. Therefore, we need to consider all physical parameters comprehensively. Firstly, it is necessary to reduce the influence of the long-range force, where Atip should be small enough. Secondly, fq should be high to minimize frequency noise [1]. However, there is a tradeoff between Atip


Microwave photon detection by an Al Josephson junction
Beilstein J. Nanotechnol. 2020, 11, 960–965, doi:10.3762/bjnano.11.80

- filtered with feed-through capacitors at the room temperature and RC filters at the 10 mK cryostat plate, minimizing the effect of unwanted low-frequency noise. In order to avoid ground loops, the measurement scheme was designed with a single ground. For the switching current measurements, the bias current


Optical near-field mapping of plasmonic nanostructures prepared by nanosphere lithography
Beilstein J. Nanotechnol. 2018, 9, 1536–1543, doi:10.3762/bjnano.9.144

- resolution. It is worthwhile mentioning that the cut-off of the filtering process ultimately determines the spatial resolution: a compromise needs to be found to remove the high frequency noise without removing the near-field signal as noticed above. Surprisingly, no polarization effect was observed. Our


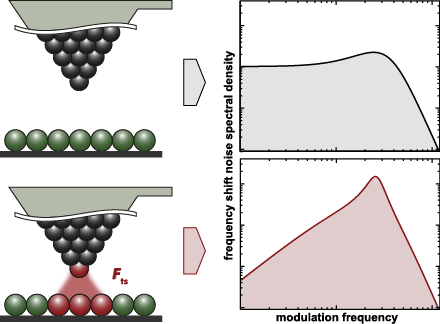
Noise in NC-AFM measurements with significant tip–sample interaction
Beilstein J. Nanotechnol. 2016, 7, 1885–1904, doi:10.3762/bjnano.7.181
- compensates low-frequency noise in the amplitude signal. Optimum performance of this loop is obtained for the parameters PA = 0.08 and IA = 1 Hz using the criteria introduced in appendix C. In conclusion, we find excellent quantitative agreement between simulated and experimental data for various settings of
- speculate that the low-frequency deviation is caused by mechanical instabilities within the system, or by instabilities within the piezoelectric excitation system. For example, low-frequency noise has been observed when using photothermal excitation [23]. Disabling the amplitude control loop results in a
- strong increase of low frequency noise compared to operation with engaged amplitude control using optimum parameters (see previous section and appendix C). The amplitude control loop effectively reduces the frequency shift noise by its negative feedback. Furthermore, we observe an increase of the


![[Graphic 32]](/bjnano/content/inline/2190-4286-7-181-i73.png?max-width=637&scale=1.18182) wit...
wit...

![[Graphic 34]](/bjnano/content/inline/2190-4286-7-181-i75.png?max-width=637&scale=1.18182) wit...
wit...


Role of solvents in the electronic transport properties of single-molecule junctions
Beilstein J. Nanotechnol. 2016, 7, 1055–1067, doi:10.3762/bjnano.7.99

- lowering the spring-borne contacts onto the pads. The droplet, about 1–2 mL, of the respective solvent is injected into the PDMS sealed pipette and carefully lowered onto the electrode device [10][11]. The set-up is installed in a closed metal case for shielding high frequency noise. The breaking mechanics


Modelling of ‘sub-atomic’ contrast resulting from back-bonding on Si(111)-7×7
Beilstein J. Nanotechnol. 2016, 7, 937–945, doi:10.3762/bjnano.7.85

- separation. Note a 10 point gaussian filter has been applied to all images to remove high frequency noise. Experimental parameters: A0 = 110 pm, Vgap = 0 V. Experimental tip heights relative to Δf feedback setpoint (top to bottom): +0.186 nm, +0.104 nm, +0.032 nm, 0 nm. Image size 3.6 nm × 3.6 nm. Data


Thermoelectricity in molecular junctions with harmonic and anharmonic modes
Beilstein J. Nanotechnol. 2015, 6, 2129–2139, doi:10.3762/bjnano.6.218

- . While figures below only display quantities related to charge and energy currents, it is useful to emphasize that the CGF contains information on fluctuations of these currents. For example, the zero-frequency noise for charge current is given from where is the second cumulant. Our derivation is based


Improved atomic force microscopy cantilever performance by partial reflective coating
Beilstein J. Nanotechnol. 2015, 6, 1450–1456, doi:10.3762/bjnano.6.150

- layer to a cantilever can degrade the Q-factor of the cantilever. A reduction in Q-factor due to a metallic coating of >100 nm thick film [2] and of thinner films [3] have been reported. Another undesirable effect caused by a metallic coating is the increased low-frequency noise which often exhibits an
- evidence that a small change in coating thickness can influence the Q-factor significantly. Experimental We measured the dependencies of low-frequency noise and Q-factor on partial metal coating coverage. As previously mentioned, different AFM modes require different cantilevers. Two types of cantilevers
- Supporting Information File 1, Figure S1 for data). Advantages for static AFM: reduced low-frequency noise For static AFM measurement such as contact mode or force spectroscopy, a low 1/f noise is important. In this section, the cantilever deflection noise density spectra of the soft cantilevers measured


Advances in NO2 sensing with individual single-walled carbon nanotube transistors
Beilstein J. Nanotechnol. 2014, 5, 2179–2191, doi:10.3762/bjnano.5.227

- of charge traps have reduced the hysteresis, drift and low-frequency noise in carbon nanotube transistors. While open challenges such as large-scale fabrication, selectivity tuning and noise reduction still remain, these results demonstrate considerable progress in transforming the promise of carbon
- previous studies are present only when the nanotube is in contact with a substrate such as SiO2. Drift and low-frequency noise Drift of a sensor may have several origins, related to the ageing of the device, changes in materials properties over time, or ultra-low frequency noise. For example, if a
- strongly suppressed in the suspended transistor, due to the absence of charge traps in the vicinity. Another closely-related aspect is the current fluctuation that is observed over very long periods of time, which can also contribute towards sensor drift. This ultra-low frequency noise in CNFETs has a 1/f


Methods for rapid frequency-domain characterization of leakage currents in silicon nanowire-based field-effect transistors
Beilstein J. Nanotechnol. 2014, 5, 964–972, doi:10.3762/bjnano.5.110

- of the authors. The number of studies considering frequency-domain measurements of SiNW FETs is very low. The authors in [9] applied low-frequency noise spectroscopy (LFNS), and characterized generation–recombination centers in silicon nanowires grown by using chemical vapor deposition. Their aim was


Noise performance of frequency modulation Kelvin force microscopy
Beilstein J. Nanotechnol. 2014, 5, 1–18, doi:10.3762/bjnano.5.1

- and optimizing around randomly chosen key values. Keywords: dynamic; frequency noise; Kelvin force microscopy; noise performance; phase noise; thermal excitation; Introduction Surface potential imaging in combination with atomic force microscopy in ultrahigh vacuum is based on the measurement of
- deflection detector. Previous studies of noise propagation often retrieve the general expression of frequency noise of a thermally excited harmonic oscillator and are not specific to a PLL based setup, and furthermore, do not extend to the noise in the KFM signal. The pioneer work on nc-AFM, [3] already
- mentions frequency noise for the first time in the context of nc-AFM, but takes into account only thermal probe excitation noise. Fukuma et al. [5] performed a detailed study on optimizing the probe deflection sensor and compare the measured noise power spectral density (PSD) at the PLL frequency output to


Towards 4-dimensional atomic force spectroscopy using the spectral inversion method
Beilstein J. Nanotechnol. 2013, 4, 87–93, doi:10.3762/bjnano.4.10

- prevent high-frequency noise in the data from being magnified into the recovered force curves through division by very small values of Tp(ω) (see Equation 3), one applies a cutoff to Zp(ω) [7][8]. This cutoff is generally set to include only a few harmonics (often only one) above the torsional resonance


Thermal noise limit for ultra-high vacuum noncontact atomic force microscopy
Beilstein J. Nanotechnol. 2013, 4, 32–44, doi:10.3762/bjnano.4.4

- simple yet accurate expression for the thermal-displacement power spectral density . As the frequency noise is represented as a function of the modulation frequency fm, it is desirable to represent the displacement noise as a function of f0 ± fm. For , we use the following approximation [1] instead of
- detection. For that purpose, the frequency noise originating from the same detection system but passed through different PLL filters is shown. As these measurements are performed in system C, the filters are modelled as a closed loop where the settings of the PI controller have a significant effect on the
- noise is even below the thermal noise for the larger amplitude. In Figure 8a, different cantilevers are compared regarding their total RMS frequency shift noise δftot (solid lines) as well as the thermal frequency noise δfth (dash-dotted lines). Here, the same bandwidth of B−3dB = 258 Hz is chosen for


![[Graphic 53]](/bjnano/content/inline/2190-4286-4-4-i64.png?max-width=637&scale=1.18182) =
= ![[Graphic 32]](/bjnano/content/inline/2190-4286-4-4-i43.png?max-width=637&scale=1.18182) f...
f...


![[Graphic 56]](/bjnano/content/inline/2190-4286-4-4-i67.png?max-width=637&scale=1.18182) using three diff...
using three diff...

Current–voltage characteristics of single-molecule diarylethene junctions measured with adjustable gold electrodes in solution
Beilstein J. Nanotechnol. 2012, 3, 798–808, doi:10.3762/bjnano.3.89

- into the PDMS sealed pipette and carefully lowered onto the electrode device [36]. The setup was installed in a closed metal case for shielding high-frequency noise and for avoiding undesired illumination of the molecules. Electrical measurement All electrical measurements were performed at room


qPlus magnetic force microscopy in frequency-modulation mode with millihertz resolution
Beilstein J. Nanotechnol. 2012, 3, 174–178, doi:10.3762/bjnano.3.18

- determine the sensitivity of the experimental setup, and thus the minimum detectable averaged force gradient , one has to calculate the frequency noise of the setup δ(Δf). In FM-AFM setups δ(Δf) is a sum of three uncorrelated noise sources [13][14]: Thermal noise deflection-detector noise and oscillator
- frequency noise is inversely proportional to the oscillation amplitude A of the force sensor. Thus, we can reduce frequency noise by using large amplitudes and therefore minimize the . Moreover, one achieves the best signal-to-noise ratio by using an amplitude that is on the order of the decay length of the
- , B ≈ 50 Hz, nq ≈ 50 fm/ and A = 50 nm. This yields a frequency noise of δ(Δf) ≈ 0.5 mHz. From Equation 1 we can now calculate the minimum detectable force gradient ≈ 5 × 10⁻⁵ Nm−1. In comparison, commercial silicon-cantilever setups with a standard MFM probe, f0 ≈ 75 kHz and k ≈ 3 Nm−1, are


